Introduction
Chart types are constructed using several settings. Among them, the most significant are:
These properties work in concert to provide unprecedented flexibility.
Chart Types
The most fundamental property, Chart.Type, determines the generic layout of series and in the case of pie, and radar, a type of chart. Axis scales further contribute to how elements are laid out, i.e. (Stacked). The series type determines how the series are drawn (line, bar, etc.).
[C#]

Chart.Type = ChartType.Radar;
[Visual Basic]Show All / Hide All Linkblock
Chart.Type = ChartType.Radar
|
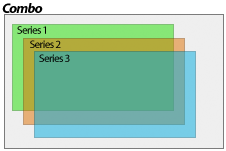
Combo Chart Type This chart type supports all the series types. It is vertically oriented so the y axis (value axis) can only contain numeric or time values while the x axis can also contain names of elements (category axis).
|
|
|
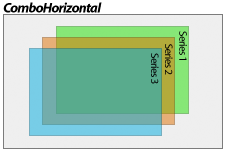
ComboHorizontal Chart Type This chart types is horizontally oriented so the x axis can only contain numeric or time values. It is the same as the Combo type except it's oriented horizontally.
Notice the X and Y properties are switched
|
|
|
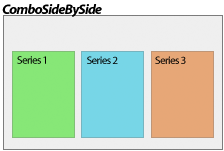
ComboSideBySide Chart Type This chart type is similar to combo but series are placed side by side and the x axis tick labels show series names instead of element names. This layout can be achieved in a normal combo chart by transposing the data.
|
|
|
Pie Chart Type Shows a single pie consisting of all the series added to the chart where each slice represents a series.
|
|
|
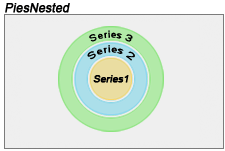
PiesNested Chart Type Shows a series of nested pies.
Scale.Stacked Scale.Normal
|
|
|
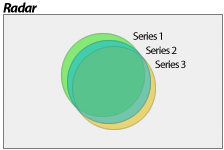
Radar Chart Type Draws all series on a single radar. Both x and y axes are used. The x axis surrounds the radar and the y axis goes from the center to the outside.
Supported Series Types
Polar Charts
The radar chart can support standard spider and polar axes. If the x axis uses a category scale, the default will be a spider axis (resembling a spider web). If the axis uses a numeric or time axis, the type will default to Polar. The type can also be specified explicitly using:
[C#]
Chart.XAxis.RadarMode = RadarMode.Polar;
[Visual Basic] Chart.XAxis.RadarMode = RadarMode.Polar
|
 |
|
MultipleGrouped Chart Type Draws all series as elements of a single object such as types specified by SeriesTypeMultiple. Supported Series Types (SeriesTypeMultiple)
|
|
|
Gauges Chart Type Shows each series as a gauge. Each can be a different GaugeType.
Please refer to the Gauges Tutorial for detailed documentation. |
|
|
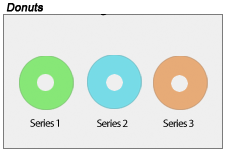
Donuts Chart Type The series are laid out in a way that allows for the maximum space usage. One donut for each series. Supported Series Types
Related properties:
|
|
|
Radars Chart Type Shows a radar for each series in the chart.
Supported Series Types
Polar Charts
The radar chart can support standard spider and polar axes. If the x axis uses a category scale, the default will be a spider axis (resembling a spider web). If the axis uses a numeric or time axis, the type will default to Polar. The type can also be specified explicitly using:
[C#]
Chart.XAxis.RadarMode = RadarMode.Polar;
[Visual Basic] Chart.XAxis.RadarMode = RadarMode.Polar
|
|
|
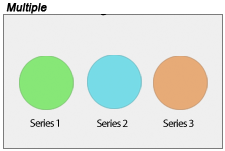
Multiple Chart Type Draws all series as individual objects. Different types are supported and can be specified by SeriesTypeMultiple for each series simultaneously. The benefit of this chart type is that it allows using different types such as pies, gauges, and the multiple types all on the same chart. Supported Series Types (SeriesTypeMultiple)
|
|
|
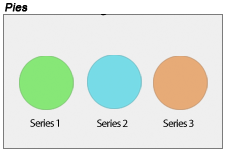
Pies Chart Type Shows a single pie for each series in the chart.
|
|
|
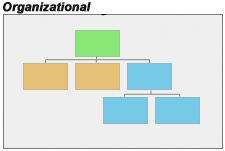
Organizational Chart Type Shows an organizational chart based on the elements in the charts series collection. Only Element annotations are used with this chart type. Annotation text can be specified but if left unpopulated, the element name text will be used inside the annotations. An organizational chart has a single element at the top with no parent. Every other element will have either ParentID or Parent property set to indicate which other element it is under. All elements can be in a single series, however, the Series.Line property is used to draw connections between elements so multiple series can be used to group elements that use the same connecting line style. Elements with no names or annotation text can be used to create more complex layouts by drawing a straight line through the location of the element as demonstrated in sample Gallery/M10
|
|
 |
Other chart types such as Bubble, Scatter, and Gantt are obsolete but available for legacy support. They default to Combo, Combo, and ComboHorizontal respectively and set other properties to resemble the legacy results. ChartType.Financial is also obsolete and unnecessary. It is provided only for backward compatibility as well. |
Series Types
The next major contributor to chart types is the series type. The above chart type list includes a section on supported series types for each. Different series types can be specified for each series simultaneously using the following chart types:
- Combo
- ComboSideBySide
- ComboHorizontal
- Radar(s)
- Multiple
- MultipleGrouped
This allows you to create virtually unlimited number of different chart types.
[C#]

mySeries.Type = SeriesType.Line;
[Visual Basic]

mySeries.Type = SeriesType.Line
- Marker
- In 3D markers have no depth
- Related Properties
- Element.Marker
- Element.YValue
- Element.YDateTime
- Series/Element.LegendEntry.Marker
- Line
- Supported in 2D and 3D.
- Each element can have a different color along the same line series.
- In 2D elements will automatically show element markers.
- Line caps can be applied to 2D lines through the Series.Line line cap properties.
- Related Properties
- Series.Line (2D)
- Element.YValue
- Element.YDateTime
- Element.Marker
- Spline
- Supported in 2D and 3D.
- Each element can have a different color along the same spline series.
- In 2D elements will automatically show element markers.
- Line caps can be applied to 2D splines through the Series.Line line cap properties.
- Related Properties
- Series.Line (2D)
- Element.YValue
- Element.YDateTime
- Series.SplineTensionPercent
- Element.Marker
- AreaLine
- Supported in 2D and 3D.
- Each element can have a different color along the same line series.
- In 2D elements will automatically show element markers.
- Supports Stacked Axis Scales.
- Related Properties
- Series.Line (2D)
- Element.YValue
- Element.YDateTime
- Element.YValueStart
- Element.YDateTime
- Element.Marker
- AreaSpline
- Supports Stacked Axis Scales.
- Related Properties
- Series.Line (2D)
- Element.YValue
- Element.YDateTime
- Element.YValueStart
- Element.YDateTime
- Element.Marker
- Column & Bar
- Supports Stacked Axis Scales.
- Supports shading effects.
- Supports Element.Outline
- Supports Element.Complete indicator which is useful with Gantt charts.
- With ComboHorizontal, gantt dependencies can be used and are defined the same way as organizational chart relationships.
- Cylinder
- Supports Stacked Axis Scales.
- Supports Element.Outline
- Supports 2D and 3D
- Cone
- Supports Stacked Axis Scales.
- Supports Element.Outline
- Pyramid
- Supports Stacked Axis Scales.
- Supports Element.Outline
- Bubble
- Requires Element.BubbleSize values.
- Supports shading effects.
- Supports Element.Outline
- Related Properties
- BubbleShape
- Requires Element.BubbleSize values.
- Supports ShadingEffectMode.One
- Supports 2D and 3D views.
- Supports Element.Outline
- Related Properties
- Element.ShapeType
- Chart.MaximumBubbleSize
- LegendEntry.ShapeType
- ShapeType Enumeration
SeriesTypeFinancial enumeration
[C#]

mySeries.Type = SeriesTypeFinancial.CandleStick;
[Visual Basic]

mySeries.Type = SeriesTypeFinancial.CandleStick
- CandleStick
- Element values used
- Open or YValueStart
- Close or YValue
- High
- Low
- Complete
- Supports column shading.
- Element values used
- Bar
- When a open value is not provided this bar will be an HLC bar, if provided it will be a OHLC.
- Open
- Close
- High
- Low
- HighLowArea
SeriesTypeMultiple enumeration
- FunnelCone
- Related Properties
- FunnelPyramid
- Related Properties
- Chart.FunnelNozzlePercentage
- Chart.FunnelNozzleWidthPercentage
- Chart.FunnelSpacingPercentage
- Related Properties
- Cone
- Pyramid
- Pie
- Gauge
- StackedBubble
- Related Properties
This series type (SeriesTypeMultiple) applies to charts using ChartType.Multiple & ChartType.MultipleGrouped.
Axis Scales
Further customization is achieved by specifying an axis scale. Besides controlling the quantitative scale type, scales also dictate how series behave. For example an axis scale can specify that columns are stacked.
See also: Element Values & Axis Scales | Element Layout and Axes | Z Axis effect
Conclusion
As you can see, the final chart type is fundamentally based on three settings. This mix and match concept may be more complicated than a single property, however, the flexibility it provides makes it well worth understanding.


 Show All
 Hide All